Percentage to CGPA Calculator
Convert your CGPA to percentage based on your university’s formula
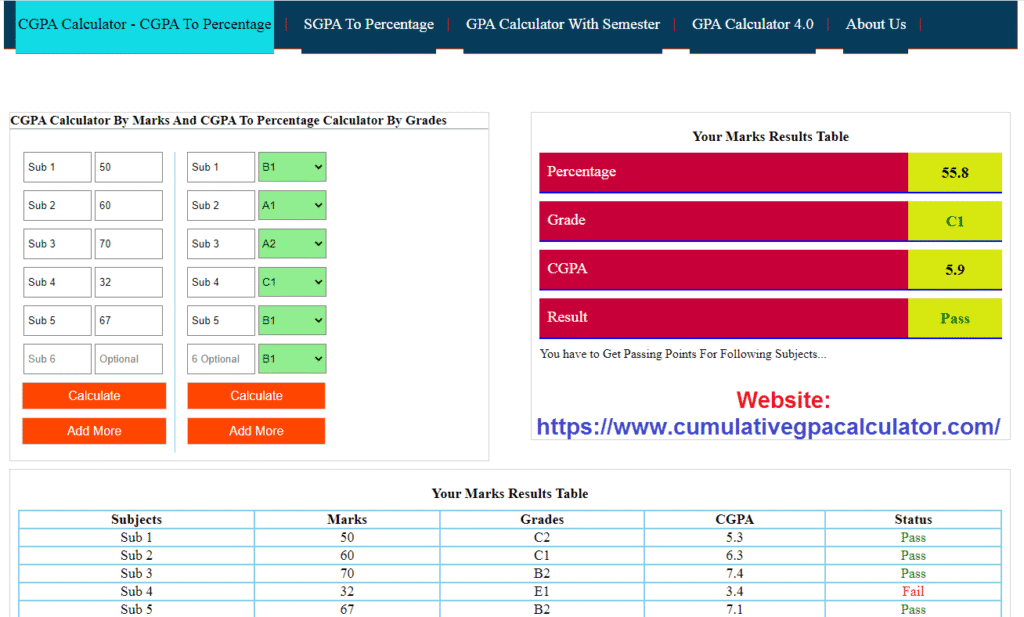
Conversion Results
Different universities use different conversion formulas. Always check with your institution for the exact formula.
Converting marks from percentage to a Cumulative Grade Point Average (CGPA) is a routine—but sometimes confusing—task for students, institutions, and employers. A reliable Percentage to CGPA Calculator simplifies that conversion, removes ambiguity, and standardizes assessment across boards, universities, and regions. This long-form guide explains what a Percentage to CGPA Calculator is, its history, objectives, implementation methods, regional and state-level implications, success stories, typical challenges, comparisons with alternative grading systems, and realistic prospects for the future. Throughout, the article keeps practical advice for students and administrators while situating the tool within policy frameworks, social equity goals, and educational reforms such as state-wise benefits and rural development initiatives.
Why a Percentage to CGPA Calculator matters
Academic credentials form the backbone of opportunities: scholarships, admissions, scholarships, jobs, and professional licensing. Yet, educational systems around the world use different grading conventions—percentages, letter grades, GPAs, and CGPA. A Percentage to CGPA Calculator acts as a translator. It turns a percentage score (e.g., 78%) into a CGPA value (e.g., 7.8 on a 10-point scale or 3.12 on a 4.0 scale), helping stakeholders make fair comparisons.
Key reasons the calculator matters:
- It reduces subjectivity when comparing achievements from different boards or universities.
- It speeds up admissions and hiring processes, especially when dealing with bulk applications.
- It supports policy implementation (for example, targeted scholarships or state-wise benefits) by providing a standardized metric for eligibility.
- It aids equitable assessment for students from rural development programs, women empowerment schemes, and other social welfare initiatives.
A well-designed Percentage to CGPA Calculator thereby contributes to transparency, operational efficiency, and fairness.
Brief history: How percentage-to-CGPA conversions evolved
Historically, educational evaluation in many countries relied on raw percentages. During the late 20th and early 21st centuries, higher education and international mobility highlighted the limitations of percentages: they were not easily comparable across curricula or borders. Several trends influenced the shift toward CGPA and the need for conversion tools:
- Internationalization of education: Students applying abroad needed a comparable metric; universities required conversion methods.
- Shift toward outcome-based grading: Institutions started adopting grade-point-based systems to better reflect learning outcomes rather than absolute marks.
- Digitization of admissions and recruitment: Online application systems demanded uniform fields such as CGPA or GPA, pushing institutions to translate percentages.
- Policy reforms and scholarship administration: Governments and scholarships programs required standard metrics to implement state-wise benefits and social welfare initiatives fairly.
As a result, the Percentage to CGPA Calculator emerged—first as manual conversion tables and later as automated tools embedded in admission portals and educational platforms.
What is a Percentage to CGPA Calculator? Definitions and variants
A Percentage to CGPA Calculator is a tool—digital or manual—that converts a percentage score into a CGPA (Cumulative Grade Point Average) or GPA (Grade Point Average) on a target scale. Variants include:
- 10-point CGPA calculators: Convert percentage to a 10.0 scale (e.g., 75% → 7.5).
- 4.0 GPA calculators: Map percentages to a 4.0 scale (e.g., 85% → 3.7).
- Board-specific calculators: Use rules set by a particular educational board (CBSE, IB, state boards).
- Weighted calculators: Consider credit hours or subject weights to compute cumulative CGPA from multiple course percentages.
- Normalized calculators: Adjust for grading distributions, curving, or difficulty differences between subjects.
Different institutions may adopt different mapping rules. For example, some use a simple linear mapping (percentage ÷ 10), while others apply banded mappings or statistical normalization. Being aware of these variants is critical for students who use a Percentage to CGPA Calculator to prepare applications or to interpret official statements.
Underlying methodology: How conversions work
There are four common approaches used by a Percentage to CGPA Calculator:
Linear scaling
This is the simplest method: divide the percentage by 10 for a 10-point CGPA (or multiply by a conversion factor for other scales). For example:
- 87% → 8.7 CGPA (on 10-point scale)
Linear scaling preserves proportionality but may not account for differences in grading standards across boards or institutions.
Banded mapping
In banded mapping, percentage ranges map to discrete grade points. For example:
- 90–100% → 10.0
- 80–89% → 9.0
- 70–79% → 8.0
Banded mapping simplifies evaluations and often aligns with predefined grade distributions. A Percentage to CGPA Calculator that uses banding will output fixed grade points for ranges, which is commonly used in scholarship criteria and state-level selection processes.
Weighted CGPA calculation
When aggregating multiple subject percentages, a weighted approach calculates CGPA by considering credit hours or subject importance:
- Convert each subject percentage to grade points.
- Multiply by subject credits.
- Sum the weighted grade points and divide by total credits.
This variant is especially useful for undergraduate programs and provides a more accurate cumulative metric.
Statistical normalization
For fairer cross-institutional comparisons, some calculators apply normalization by accounting for:
- Average score of the cohort
- Standard deviation
- Maximum achievable marks
This advanced approach is used in competitive admissions or employment settings to adjust for systemic differences. The Percentage to CGPA Calculator with normalization attempts to level the playing field for students from different boards and backgrounds.
Objectives and intended outcomes
A robust Percentage to CGPA Calculator aims to:
- Standardize assessments across diverse educational systems.
- Enable fair comparisons for admissions, scholarships, and employment.
- Improve transparency in selection processes.
- Support policy frameworks by providing a measurable metric for state-wise benefits, social welfare initiatives, and women empowerment schemes.
- Facilitate digital workflows—making application portals and institutional databases interoperable.
These objectives are aligned with wider educational goals: improving access, reducing bias, and ensuring merit-based opportunities, particularly for underserved regions and rural development beneficiaries.
Implementation: Best practices for institutions
Implementing a Percentage to CGPA Calculator within an institution or government portal requires careful planning.
1. Select a conversion methodology
Institutions must choose between simple linear mapping, banded mapping, or normalization. The choice should reflect the institution’s admissions philosophy and the diversity of applicants.
2. Publish conversion rules
Transparency builds trust. Publishing the calculator logic—conversion tables, weighting schemes, and normalization parameters—helps applicants understand outcomes.
3. Integrate with admission systems
Embedding the calculator into application forms or student information systems streamlines processing. Ensure the calculator handles bulk uploads and different input formats (percentage out of 100, marks out of varying totals).
4. Audit and validate
Regular audits confirm the calculator produces expected results. Validation against historical admissions decisions helps institutions refine mappings.
5. Localize for regional needs
State-specific rules or scholarship eligibility often require customization. For example, a state education board might mandate a particular mapping for state scholarships. The Percentage to CGPA Calculator should be flexible enough to implement state-wise benefits criteria.
6. Train staff and communicate to students
Administrative staff and counselors must understand how conversions work, especially when addressing student grievances or interpreting outcomes tied to women empowerment schemes or rural development quotas.
State-level impact and policy implications
A Percentage to CGPA Calculator is more than a technical tool; it intersects with policy, equity, and regional planning.
State-wise benefits and scholarship allocation
Governments often distribute scholarships or reservation benefits based on academic metrics. A standardized CGPA makes it easier to:
- Allocate funds to meritorious students across regions.
- Implement targeted programs focused on women empowerment schemes.
- Monitor the impact of state-sponsored educational initiatives and adjust funding.
Rural development and outreach
Standardized CGPA calculations help identify talent in rural areas. When admissions and scholarship committees use consistent metrics, they can:
- Detect outliers and high performers from under-resourced districts.
- Direct state-wise benefits or remedial programs to areas where percentages may underrepresent learning potential due to resource constraints.
Policy framework and accountability
Integrating a Percentage to CGPA Calculator into public education systems improves accountability. Policymakers can:
- Track changes in average CGPA after interventions (teacher training, infrastructure upgrades).
- Build data-driven arguments for social welfare initiatives.
- Assess whether women empowerment schemes are translating into measurable academic gains.
In short, a reliable conversion tool supports more equitable and evidence-based policy.
Regional and institutional adoption: Examples and models
Different regions and institutions have adapted their own models. A few illustrative approaches:
National standardized conversions
Some countries adopt a national conversion rule for college admissions. This approach is simple and consistent but may not reflect local grading cultures.
Board-specific rules
Several educational boards publish official conversion charts. For instance, particular state boards and national boards may issue guidance on mapping percentages to CGPA, and universities often accept those official conversions.
University-level discretion
Universities sometimes define their own calculations—especially in postgraduate admissions—considering subject difficulty and departmental standards.
Portal-based automated calculators
Admission portals now often include automatic calculators that instantly convert uploaded mark sheets into CGPA. This reduces manual errors and speeds evaluations.
Each model balances fairness, transparency, and administrative feasibility. The best practice is often a hybrid approach: a transparent base conversion with allowances for weighted or normalized adjustments where necessary.
Success stories: Where calculators improved outcomes
A number of institutions and states have reported benefits after standardizing conversions.
Case: Streamlined scholarship distribution
An education department that implemented an online Percentage to CGPA Calculator observed faster scholarship disbursements, fewer disputes, and clearer eligibility lists. Applicants could see their converted CGPA in real time and plan accordingly.
Case: Improved cross-board admission fairness
A national university that adopted a normalization-based calculator for admissions noticed improved representation from regions where grading was historically stricter. The system allowed talented students from rural development programs to compete on fair footing.
Case: Employer recruitment efficiency
Companies that hired at scale used a conversion tool to shortlist candidates from multiple boards. This cut processing time and improved the consistency of hiring outcomes.
These examples show that a carefully implemented Percentage to CGPA Calculator can produce measurable administrative gains and advance social equity goals like women empowerment schemes and regional inclusiveness.
Challenges and common pitfalls
Despite benefits, implementing and relying on a Percentage to CGPA Calculator is not without problems.
1. Lack of universal standards
Different boards and institutions use different scales and philosophies. Without a universally accepted standard, conversions can vary, causing confusion.
2. Over-reliance on mechanical conversion
Mechanical conversions can ignore context—such as strict grading standards or subject difficulty—leading to unfair comparisons.
3. Data quality and input errors
Errors in data entry (wrong total marks, incorrect subject credits) can produce misleading CGPA values. Input validation is essential.
4. Misinterpretation by stakeholders
Students and parents may not understand banded vs. linear mappings, leading to unrealistic expectations. Clear communication is necessary.
5. Gaming and manipulation risk
When high-stakes benefits are attached to converted CGPA, there is risk of gaming—boards or institutions might inflate marks to improve apparent performance. Strong audit mechanisms are necessary.
6. Accessibility and digital divide
Rural students or under-resourced schools may lack access to online calculators. Offline or mobile-friendly solutions are required to bridge the digital gap.
Addressing these challenges requires both technical safeguards and policy-level oversight.
Comparisons: Percentage to CGPA Calculator vs other grading approaches
To appreciate the calculator’s role, let’s compare conversion-driven systems with other approaches.
Percentage-only systems
Pros:
- Familiarity and simplicity.
- Direct reflection of raw marks.
Cons:
- Poor comparability across boards.
- Vulnerable to grade inflation or differing assessment philosophies.
GPA/CGPA native systems
Pros:
- Better reflect relative performance within institutional contexts.
- Favor continuous assessment and diverse evaluation metrics.
Cons:
- Hard to compare across institutions without conversions.
- Conversion still needed for cross-border recognition.
Rank-based assessments (percentile/rank)
Pros:
- Rank situates a student relative to peers; useful in competitive exams.
Cons:
- Lacks granularity and may not capture absolute competence.
Percentage to CGPA Calculator (conversion model)
Pros:
- Bridges systems, enabling comparison and standardization.
- Flexible to institutional needs (banded, linear, weighted, normalized).
Cons:
- Requires agreed methodology and transparency to avoid disputes.
Overall, the Percentage to CGPA Calculator often serves as the practical compromise, facilitating mobility and administrative efficiency.
Practical advice for students: Using a Percentage to CGPA Calculator effectively
If you are a student preparing applications or interpreting your academic metric, these pointers will help you use a Percentage to CGPA Calculator wisely.
Know the target scale
Confirm whether the receiving institution expects CGPA on a 10-point or 4-point scale, and whether specific boards require particular mappings.
Check official guidelines
Some universities or scholarship programs publish official conversion rules. If available, use those instead of third-party tools.
Use weighted calculations for cumulative CGPA
When converting multiple semesters or subjects, prefer calculators that allow credit weighting to reflect workload differences.
Keep supporting documentation
If you use a calculator for an application, retain a copy of the conversion table and your original marks. This helps resolve queries.
Beware of rounding rules
Different systems apply different rounding rules. Know whether your CGPA will be truncated, rounded up to two decimals, or displayed as a single decimal point.
Seek institutional confirmation
When in doubt, request official conversion from the issuing university or board; this is often accepted as authoritative during admissions.
Applying these best practices ensures the Percentage to CGPA Calculator is an instrument of clarity, not confusion.
Implementation roadmap for policymakers and education departments
For governments and state education departments seeking to adopt standardized conversion tools as part of education reform, follow a structured roadmap.
Phase 1: Consultation and standards
- Convene boards, universities, and teacher representatives.
- Establish a transparent conversion standard or set of acceptable methodologies.
- Ensure alignment with state-wise benefits and social welfare initiatives.
Phase 2: Build infrastructure
- Develop secure, scalable calculators integrated with admission and scholarship portals.
- Ensure offline/low-bandwidth options for rural areas.
Phase 3: Pilots and validation
- Run pilots across districts with different grading cultures.
- Validate outcomes against follow-up performance and fairness metrics (for example, access increases among beneficiaries of women empowerment schemes).
Phase 4: Rollout and monitoring
- Publish conversion rules and provide helpdesks.
- Monitor metrics such as application processing time, dispute rates, and geographic representation.
Phase 5: Iteration and capacity building
- Train administrators and counselors.
- Iterate conversions based on empirical evidence.
This roadmap ensures the Percentage to CGPA Calculator supports broader goals like equitable education, rural development, and accountable policy frameworks.
Technology and security considerations
When building a digital Percentage to CGPA Calculator, technology and data governance are vital.
Data privacy
Protect student records in compliance with applicable privacy laws. Minimize storage of personally identifiable information and employ encryption for sensitive data.
Audit logs
Keep audit trails for conversions to detect manipulation and to resolve disputes. Audit trails support transparency when dealing with state-wise benefits distribution.
Accessibility
Design interfaces that support multiple languages, screen readers, and low-bandwidth access. Mobile-first design benefits students in remote areas.
Interoperability
Use standard data formats (CSV, XML) and APIs to integrate with national databases, scholarship portals, and employer interfaces.
Testing and verification
Thoroughly test calculators across edge cases: different total marks, negative inputs, partial credits, and non-standard grade scales.
Security and design excellence ensure the Percentage to CGPA Calculator is trusted, reliable, and inclusive.
Future prospects: Where conversions are headed
Looking ahead, the role of a Percentage to CGPA Calculator will expand and adapt with educational innovation.
Competency-based metrics
As education systems shift toward competency-based assessments, future calculators may translate percentage and competency rubrics into hybrid CGPA-style indicators that reflect mastery rather than mere scores.
AI-assisted normalization
Machine learning could enhance normalization by learning patterns across boards, accounting for difficulty, and predicting long-term academic success to refine conversion logic.
Cross-border credential frameworks
International frameworks (such as standardized credential passports) may adopt conversion standards that rely on sophisticated calculators, improving global mobility.
Greater policy integration
Governments may tightly integrate calculators with social welfare initiatives so that state-wise benefits, women empowerment schemes, and rural development programs rely on transparent academic metrics for eligibility and monitoring.
Blockchain-backed verification
Immutable records of conversions and original marks could be stored on distributed ledgers, reducing fraud and improving trust in converted CGPA values.
These directions suggest the Percentage to CGPA Calculator will remain central to modern educational ecosystems, evolving in sophistication and social impact.
Ethical considerations
Conversion tools must be designed and used ethically.
Avoid reinforcing inequality
If conversions systematically favor students from certain boards, they can amplify existing inequities. Ensure normalization considers structural factors affecting performance.
Transparency and consent
Students should know how their marks are converted and consent to use of their data, especially when linked to eligibility for social welfare initiatives or scholarships.
Prevent misuse
Strong governance should prevent gaming, collaboration between institutions to inflate marks, or manipulation of conversion tables for political ends.
Ethical deployment ensures the Percentage to CGPA Calculator supports fairness and social justice.
Frequently asked questions
Closing thoughts: Making the tool work for everyone
The Percentage to CGPA Calculator is a deceptively simple tool with far-reaching effects. When designed transparently and embedded within sound policy frameworks, it helps distribute opportunities more equitably—whether through state-wise benefits, women empowerment schemes, rural development programs, or national scholarship initiatives. For students, it demystifies cross-system comparisons and eases transitions between boards and countries. For institutions and policymakers, it streamlines operations and informs data-driven decisions.
To realize the full potential of a Percentage to CGPA Calculator, stakeholders must prioritize:
- Transparency (publish the conversion logic),
- Equity (use normalization where necessary),
- Accessibility (ensure mobile and offline access),
- Security (protect student data), and
- Ongoing evaluation (measure impact on access and outcomes).